
CONSUMER-PRICE inflation has risen to 5.4% in America, the highest in 30 years. On November 3rd the Federal Reserve said it would taper bond purchases, a step towards higher interest rates. Most economists say that this bout of inflation is a result of temporary disruptions caused by covid-19, and that it will pass. But some think it presages a longer-term trend.
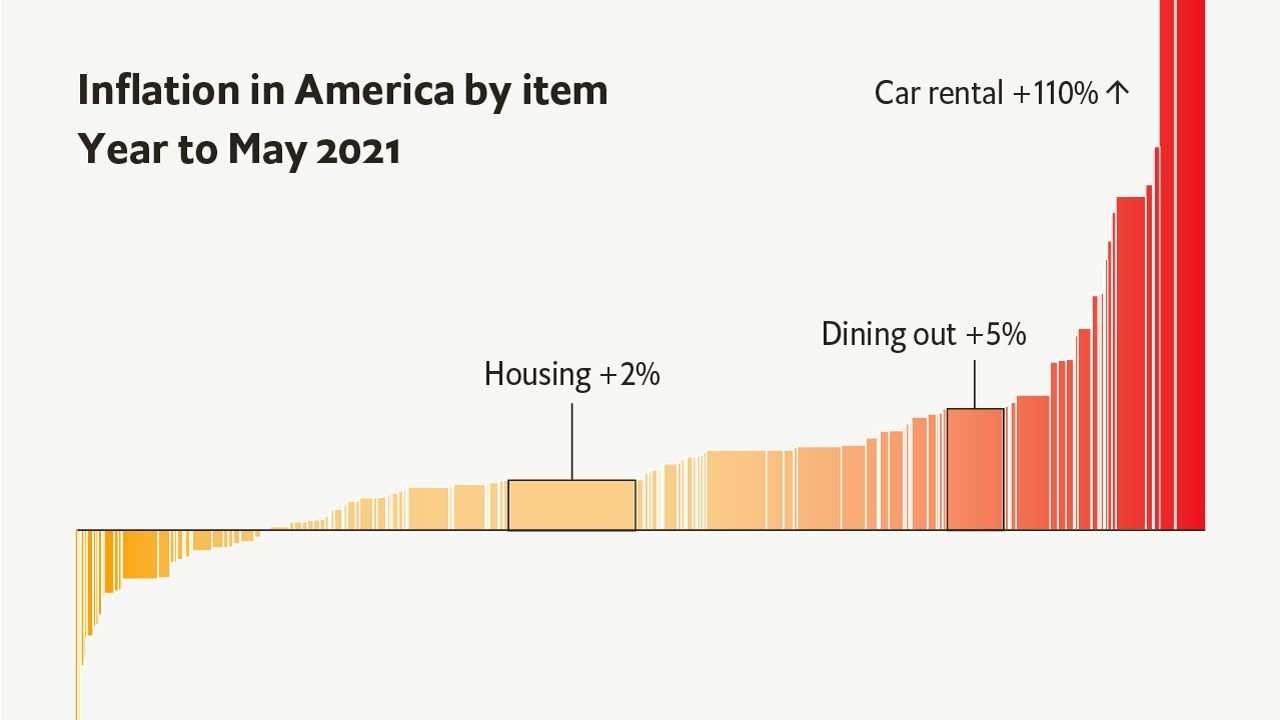
A leading argument by inflation doves has been that just a few items have caused a large share of total price increases. In the quarter to August used cars, hotel rooms and airfares made up less than 5% of America’s consumer-price index, but together accounted for the majority of overall inflation. “This is really extreme,” Paul Krugman, an economist, wrote at the time, “and does suggest transitory bottlenecks rather than broad-based inflation pressure.”
This case rests on two claims, which both merit scrutiny. One clearly stands up: when compared with past periods with similar inflation, current price rises are indeed unusually concentrated. The other—that inflation is likely to slow down as a result—is also broadly true. However, this effect is too small for the Fed to breathe easy.
To test these hypotheses, we built a dataset of price levels since 1959 for every item—from housing to lottery tickets—in the personal consumption expenditures (PCE) index, one of the Fed’s preferred metrics. For each rolling 12-month period, we calculated a measure of how much price changes vary between items: their standard deviation. When a few components account for a large share of inflation, this number is high. When most items’ prices change by similar amounts, it is low.
In general, standard deviations are correlated with inflation: the higher the average increase in prices, the more specific items’ price changes differ from each other. However, some eras were unusual, with inflation that was either low but concentrated, or high but broad. To identify such outliers, we measured the “excess” concentration of inflation in each time period: the gap between the actual standard deviation of price changes and what you would expect based on overall inflation.
This measure is now abnormally high. During the year to May inflation was more excessively concentrated than in 97% of rolling 12-month periods since 1961. It has dipped slightly as used-car prices have levelled off, but still sits in the 89th percentile.
What does this mean for future inflation? Historically, when excess concentration has been high, the present has been a poor guide to the future. When inflation is above its ten-year average, as it is now, high excess concentration makes it more likely to fall. This pattern should lead forecasters to reduce their predictions for inflation.
The notion that a…
Read More: A handful of items are driving inflation in America


