

US Dollar Index, DXY, AUD/USD, NZD/USD, Time Cycle Analysis – Talking Points:
- Time-cycle analysis suggests the US Dollar is poised to significantly underperform its major counterparts in the medium to long term.
- AUD/USD soaring towards key psychological resistance.
- NZD/USD eyeing a test of the 2018 high.

Recommended by Daniel Moss
Get Your Free USD Forecast
As mentioned in previous reports, the haven-associated US Dollar may continue to lose ground against its major counterparts, as long-term price analysis suggests a cyclical downturn is in the offing.
US Dollar Index (DXY) Monthly Chart – Extended Losses Appear in the Offing
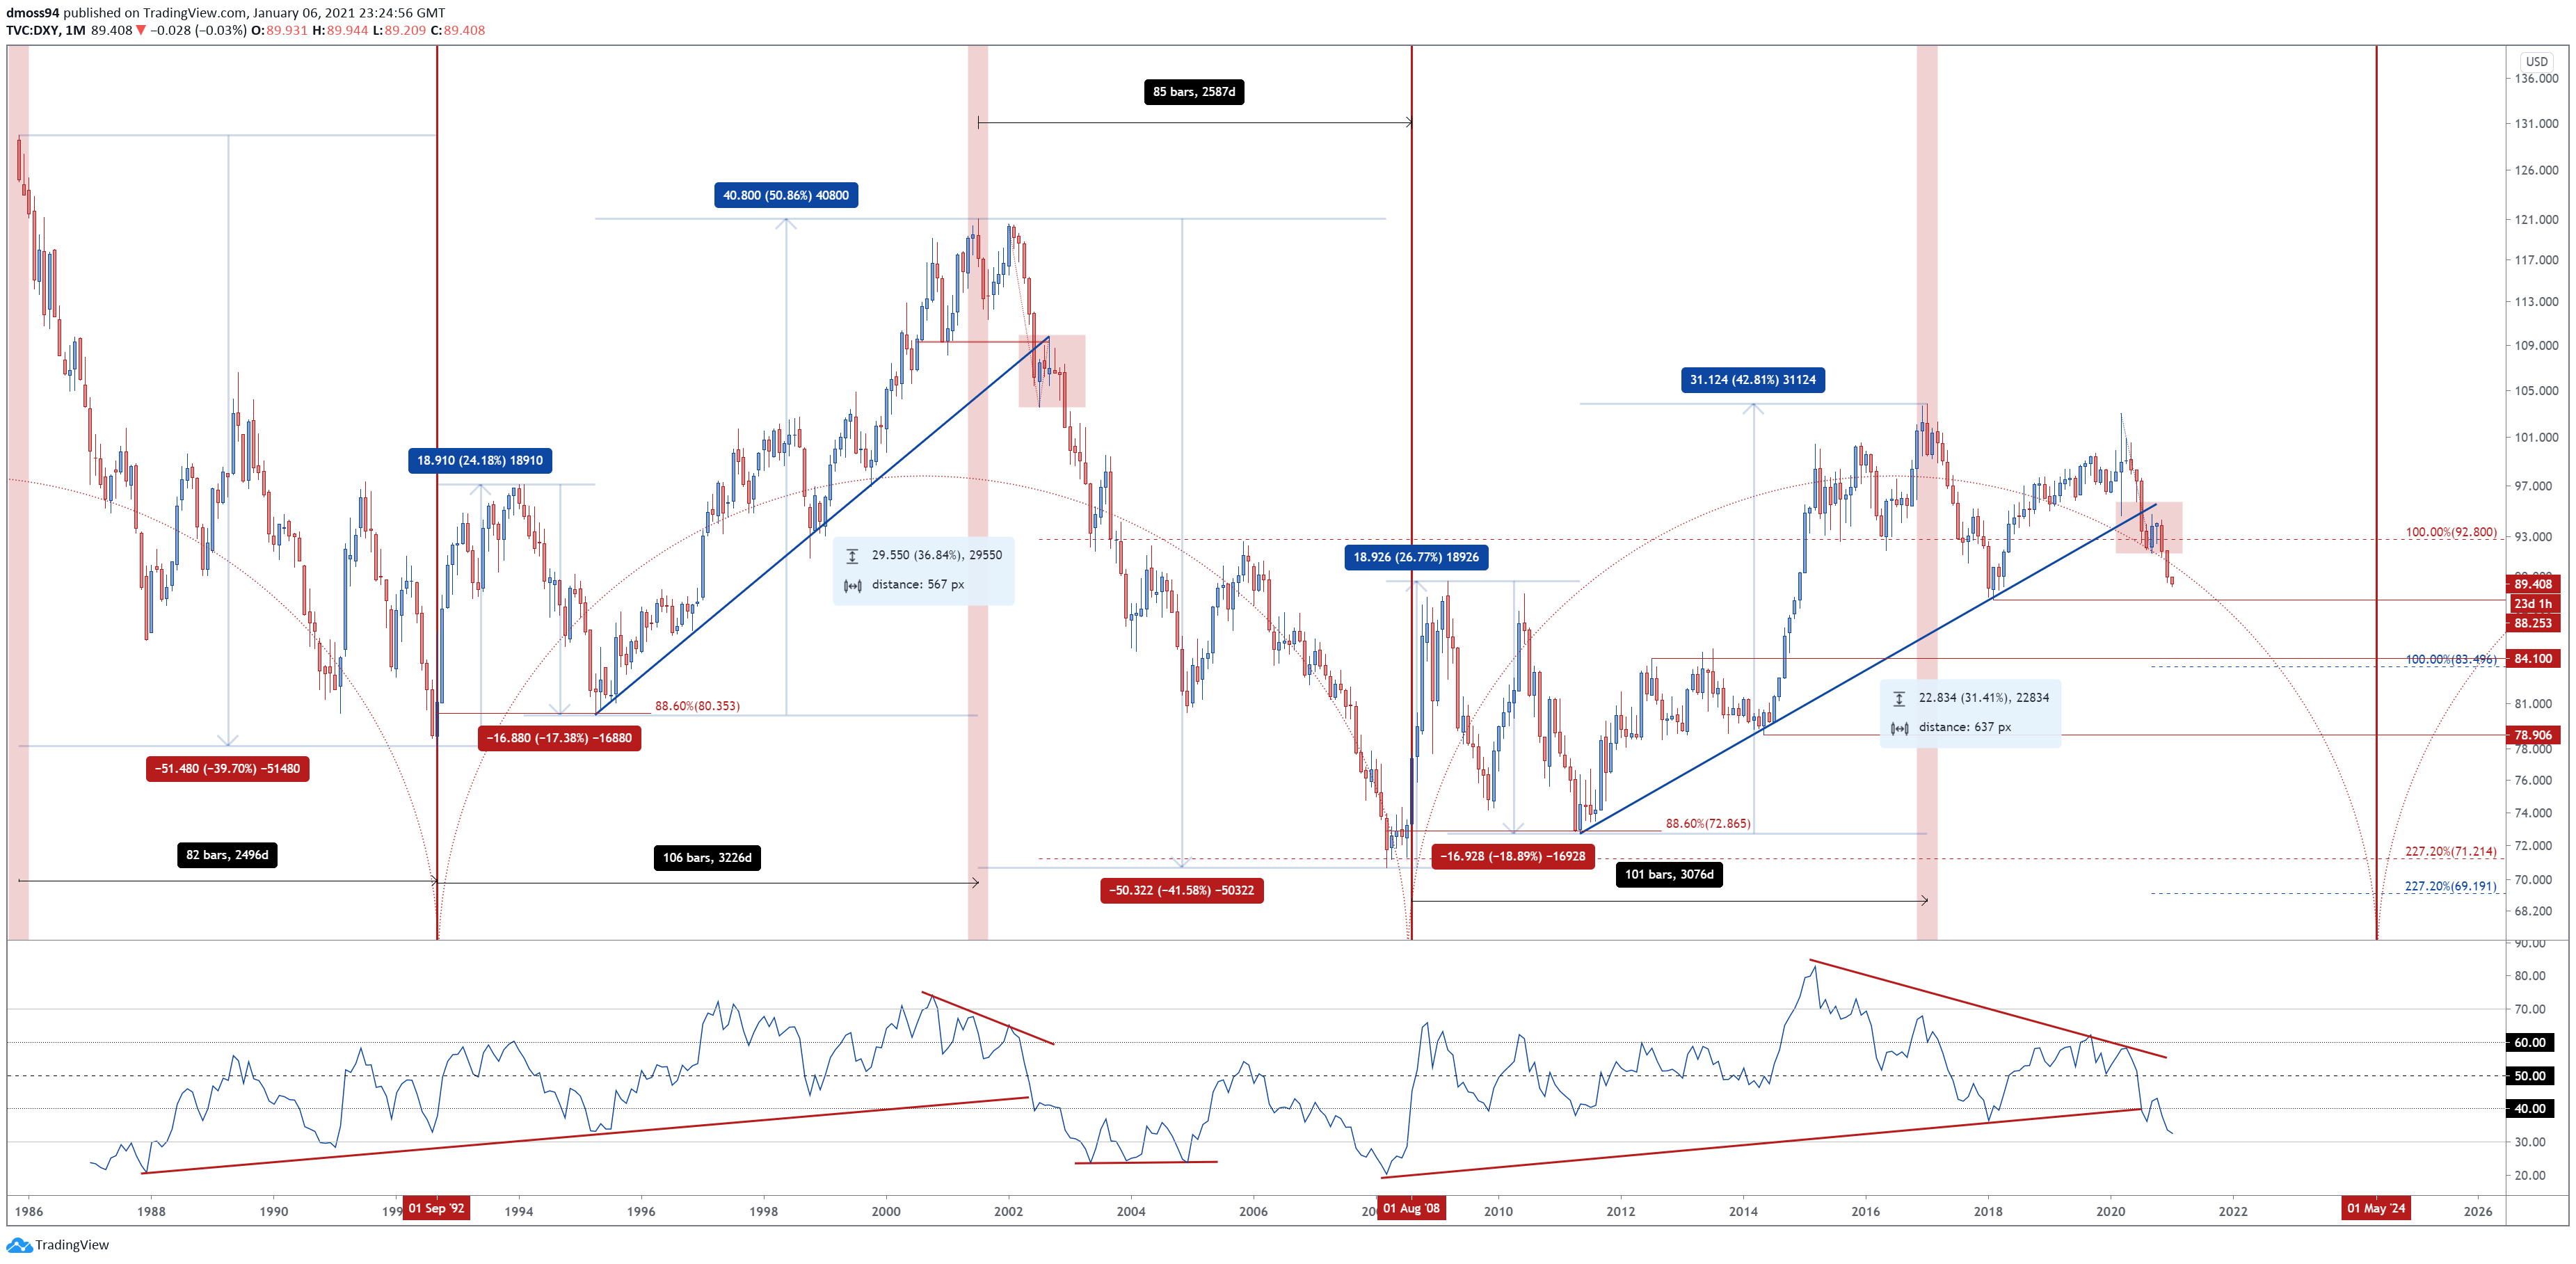
DXY monthly chart created using Tradingview
The chart above highlights the cyclical pattern seen in the US Dollar Index over the past 34 years, with the DXY largely adhering to what appears to be a 16-year rotation. The index set significant bottoms in 1992 and 2008.
After bottoming out, price then seems to rebound aggressively early in the cycle, soaring 24.1% and 26.8% in 1993 and 2009 respectively, before pulling back to key support at the 88.6% Fibonacci. A 6-year period of sustained USD strength follows this counter-trend pullback, with price climbing 50.1% from the 1995 low and 42.8% from the 2011 low, to set key highs in 2001 and 2017.
Bearish RSI divergence in late 2002 seemed to signal the end of the US Dollar’s bull run and triggered a shift in overall market sentiment, as price collapsed through uptrend support and fell 41.6% to eventually bottom in March 2008.
Recent price action and the development of the RSI is strikingly similar to that seen in the first quarter of 2003 and could be indicative of further downside for the DXY, as price slices through Bear Flag support (91.74) and hurtles towards the 2018 low (88.25).
An extended downside push towards the 100% Fibonacci expansion (83.50) looks likely if the 2018 low is breached, with cycle analysis suggesting price could fall a further 23% from current levels before bottoming out in mid-2024.
AUD/USD Weekly Chart – Soaring Towards Psychological Resistance
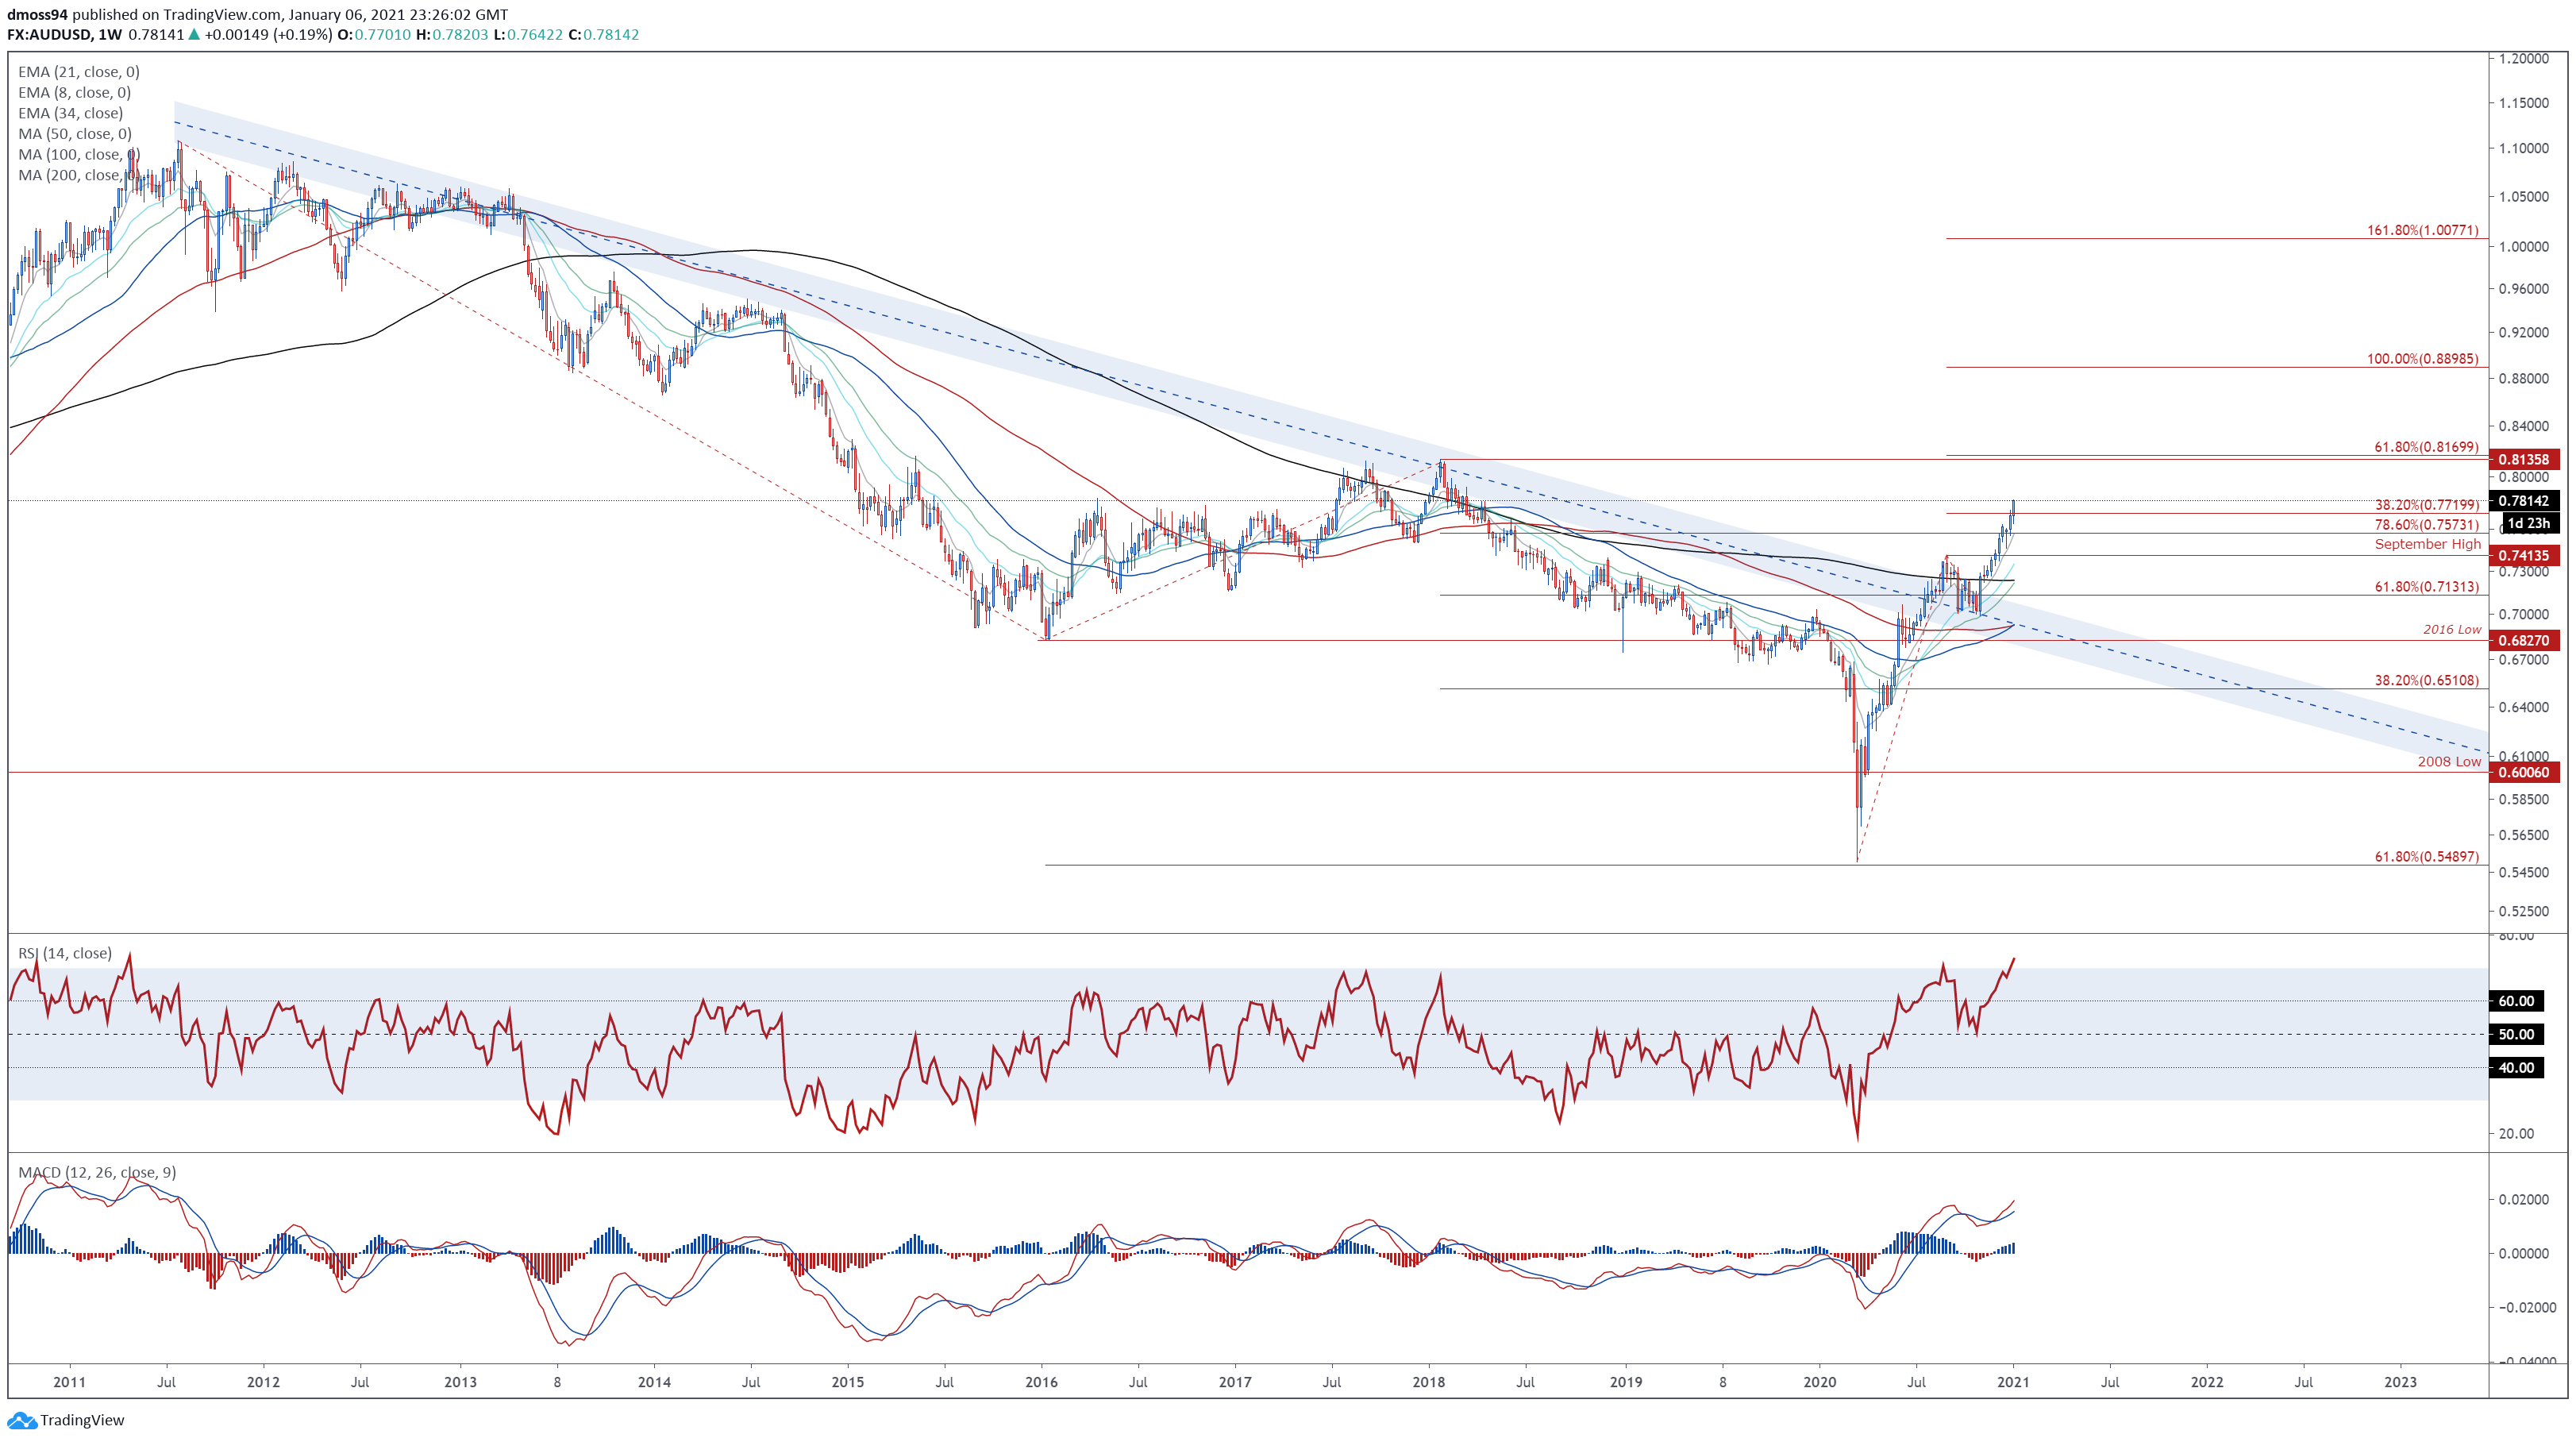
AUD/USD weekly chart created using Tradingview
Weekly AUD/USD price action also hints at further losses for the Greenback, as price surges towards psychological resistance at the 0.8000 mark.
With the RSI climbing to its most extreme readings since late 2011, and the 50- and 100-week moving averages forming a bullish ‘golden cross’ formation, the path of least resistance seems skewed to the topside.
Remaining constructively positioned above the 38.2% Fibonacci (0.7720) would probably allow buyers to challenge psychological resistance…
Read More: USD Poised to Extend Push to Multi-Year Lows


