

Japanese Yen, AUD/JPY, EUR/JPY, GBP/JPY, IGCS – Talking Points:
- Time-cycle analysis suggests that the Japanese Yen could slide significantly lower against its major counterparts.
- Inverse Head and Shoulders pattern hints at extended gains for AUD/JPY.
- EUR/JPY rates challenging long-term trend resistance.
- GBP/JPY poised to push to multi-year highs.
Long-term cycle analysis suggests that the haven-associated Japanese Yen is at risk of a prolonged period of weakness against its major counterparts. Here are the key levels to watch for AUD/JPY, EUR/JPY and GBP/JPY in the coming weeks.
JPY Index* Monthly Chart – Extended Losses on the Cards
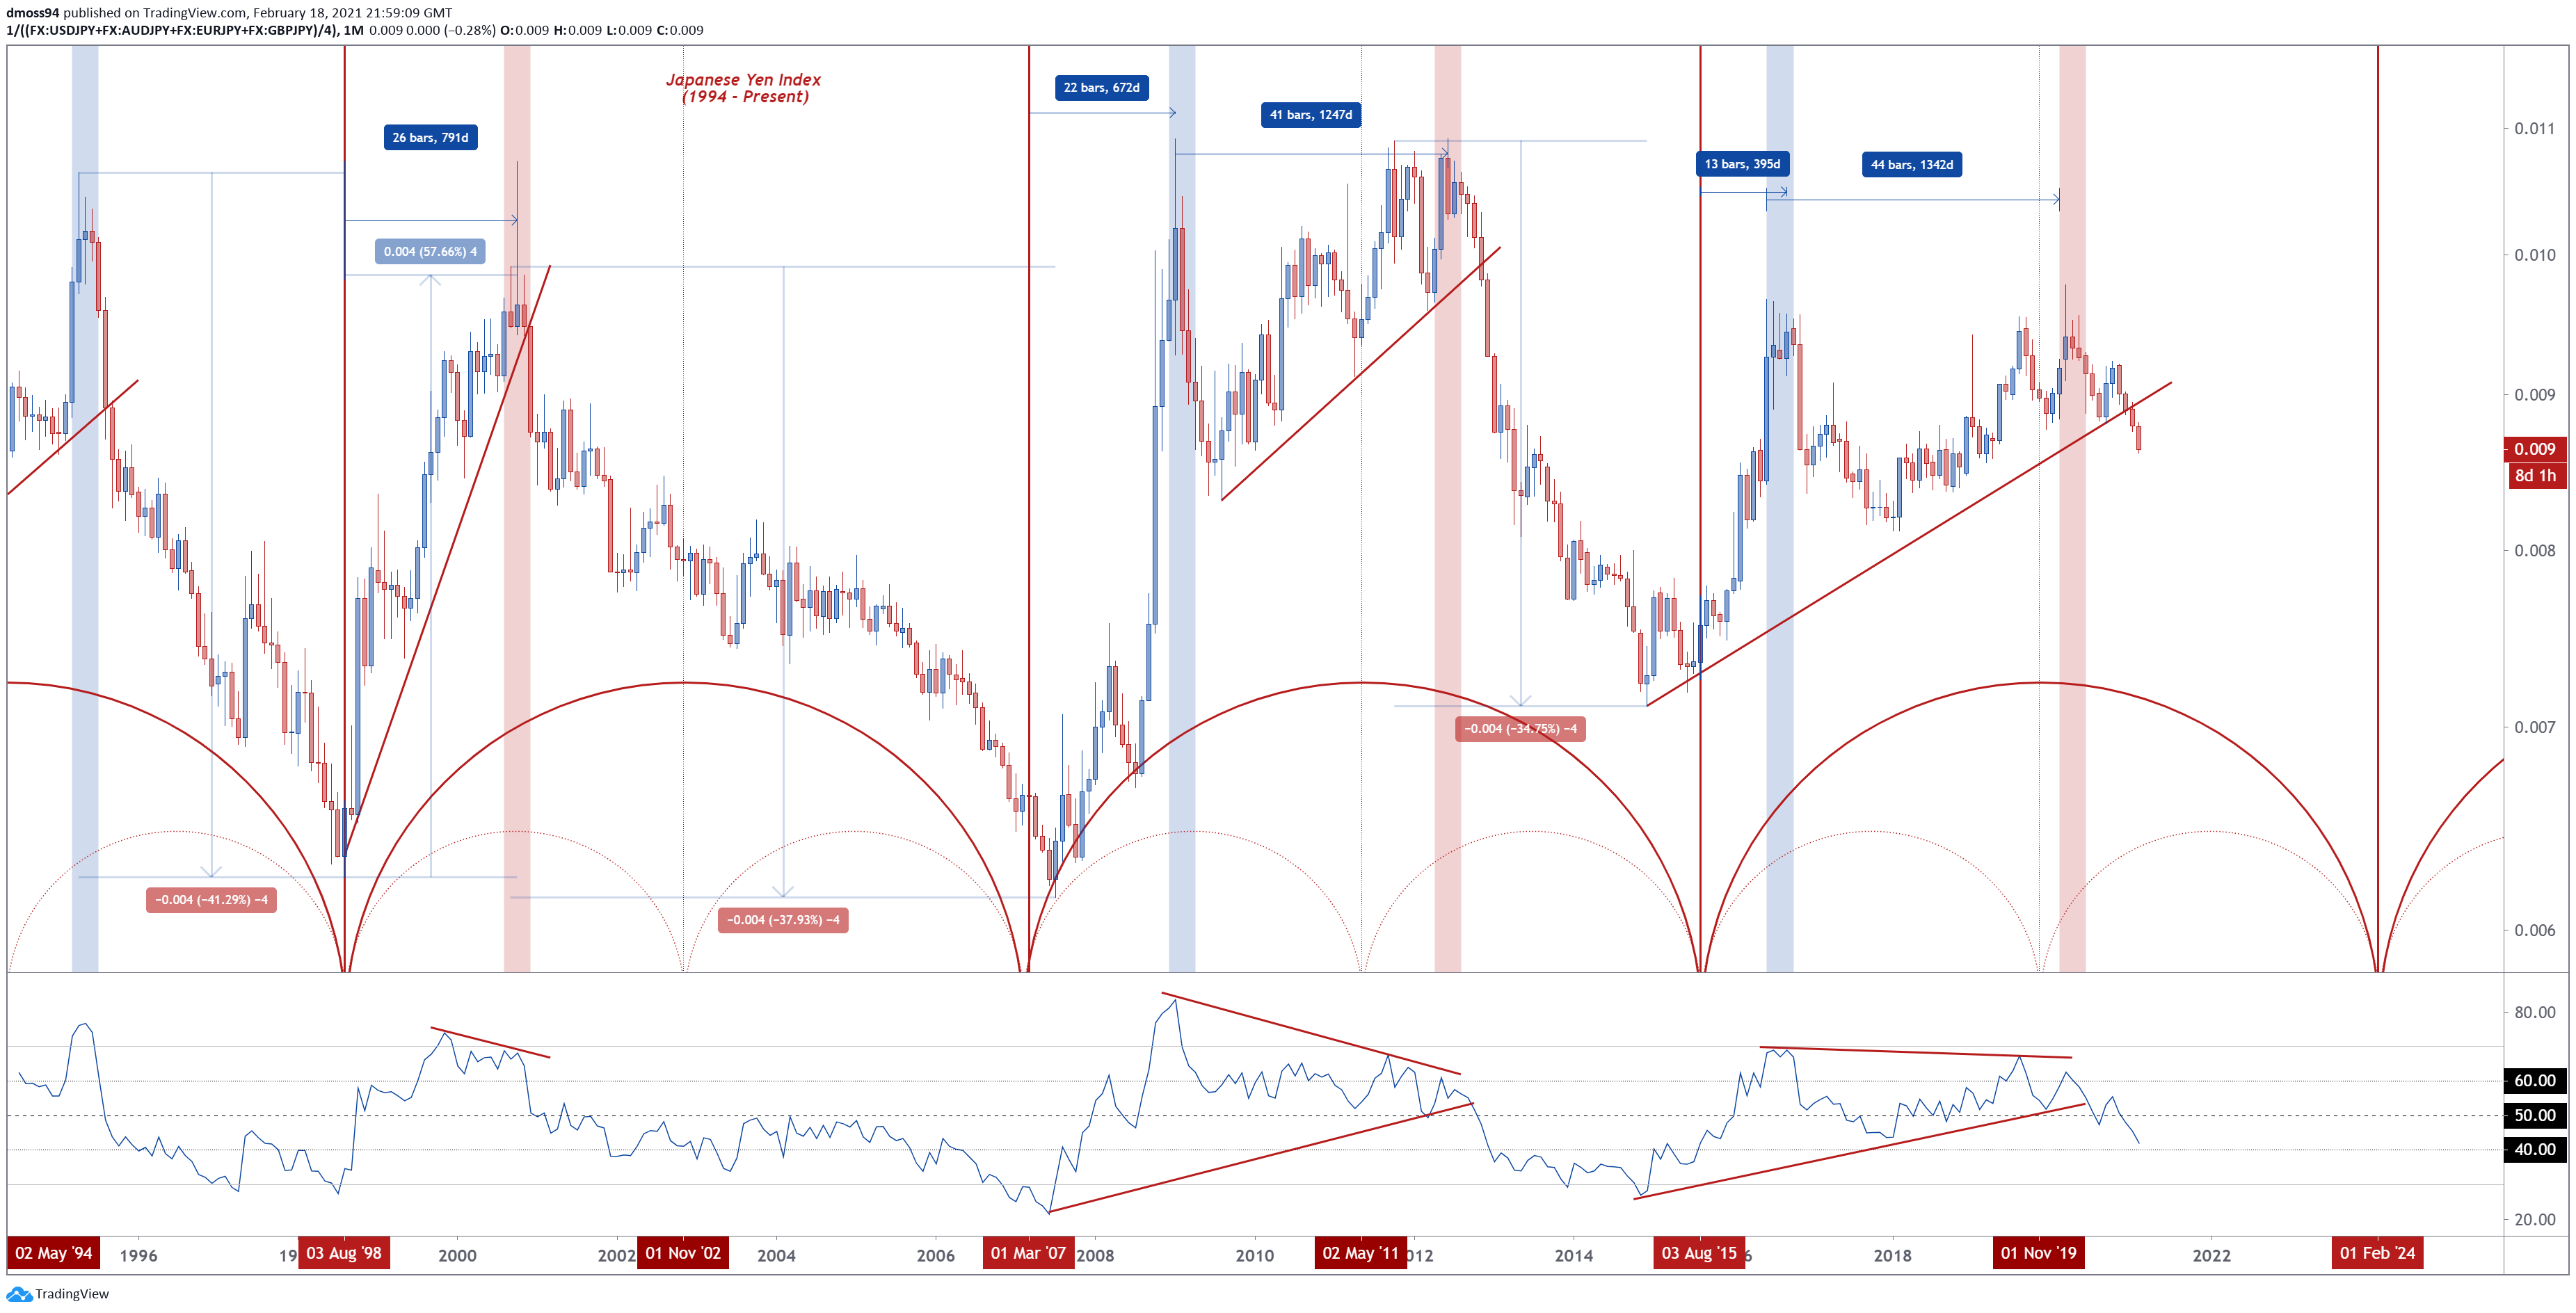
JPY Index* monthly chart created using Tradingview
*Averages USD/JPY, AUD/JPY, EUR/JPY, GBP/JPY
As noted in previous reports, the Yen largely adheres to what appears to be an 8-year rotation, with significant bottoms in the JPY index set in late 1998, early 2007 and late 2015.
After bottoming out against its major counterparts, JPY then seems to outperform early in the cycle with key highs set roughly two years after the 1998 and 2007 lows.
The formation of a Double Top reversal pattern seemed to signal the end of the currency’s bullish run in June 2012, and looks strikingly similar to the formation taking shape within the current cycle.
With that in mind, the convincing break below the uptrend extending from the 2015 low, combined with the RSI breaking to its lowest levels since 2017, could be indicative of a cyclical downturn for JPY.
Cycle analysis suggesting the Yen could fall as much as 30% from current levels before bottoming out in 2024.
AUD/JPY Weekly Chart – Inverse Head & Shoulders Points to Further Upside
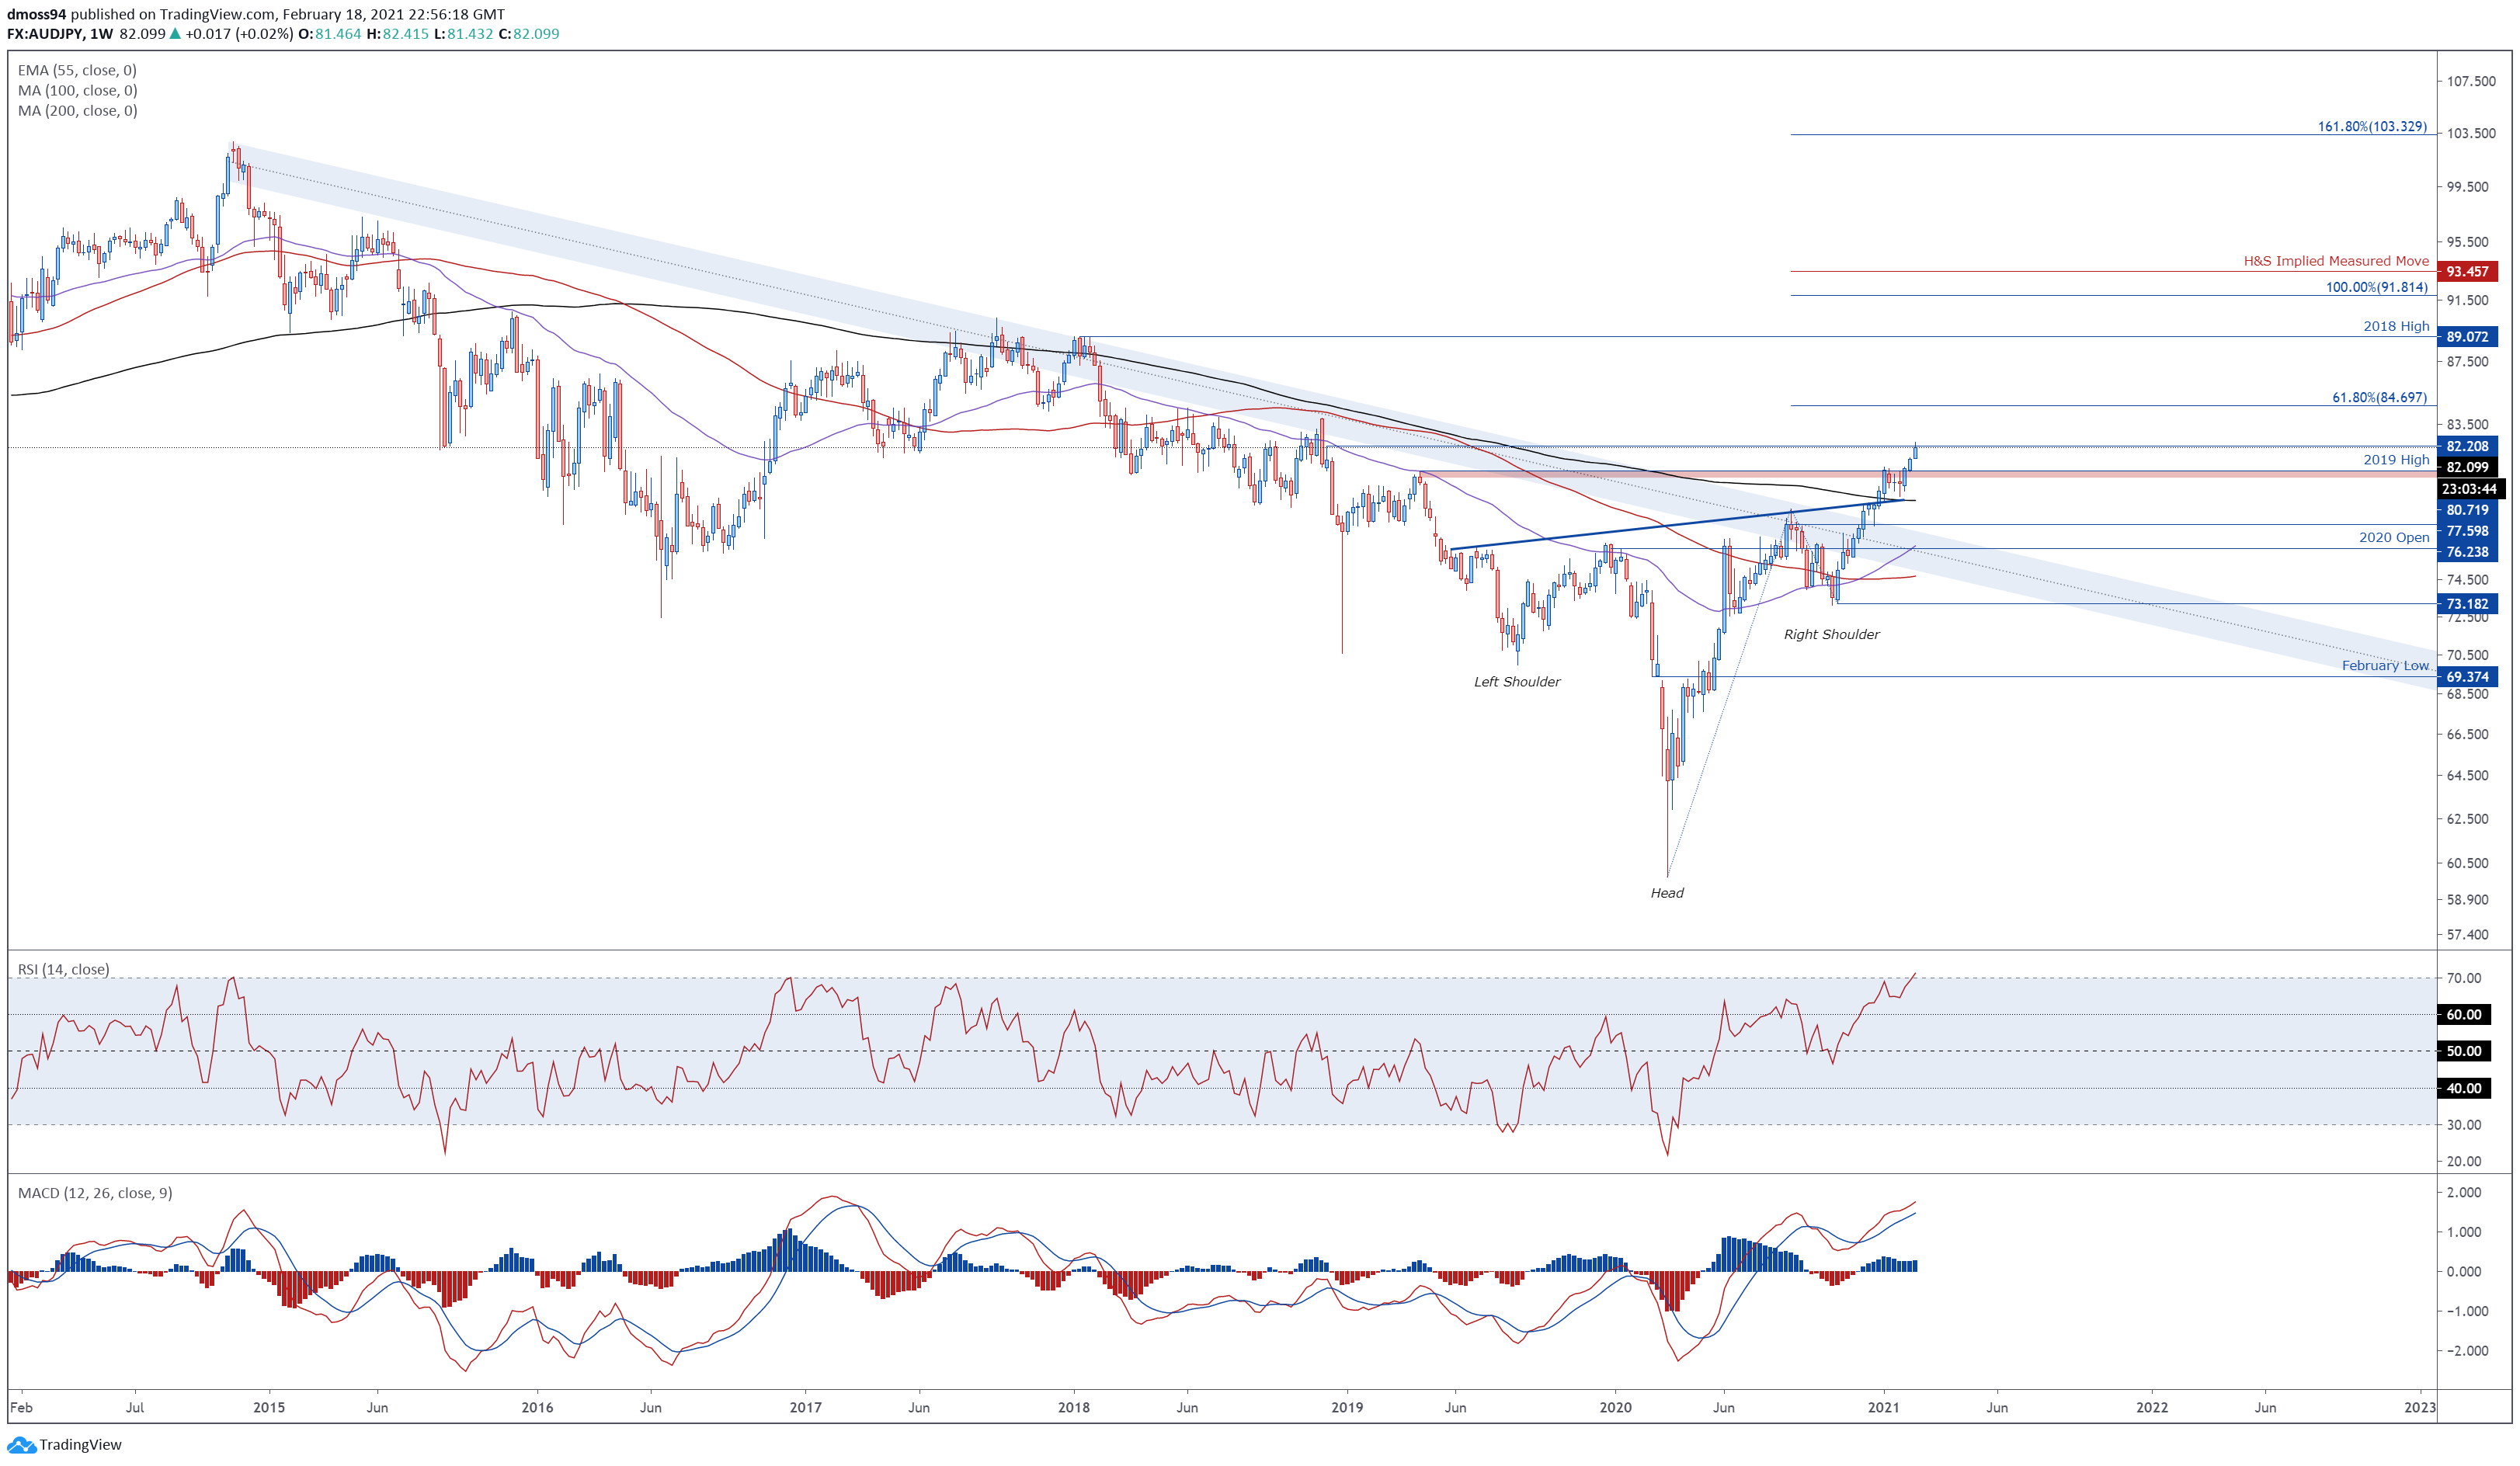
AUD/JPY weekly chart created using Tradingview
AUD/JPY seems poised to move significantly higher in the medium to long term, as price breaches the neckline of an inverse Head and Shoulders bottom and slices through the sentiment-defining 200-week moving average (78.99).
The development of the RSI and MACD are also indicative of swelling bullish momentum, as both oscillators storm to their highest respective levels since 2013.
A weekly close above 82.20 would probably open the door for buyers to challenge the 61.8% Fibonacci expansion (84.70). Clearing that brings the 2018 high (89.07) into the crosshairs.
The inverse Head & Shoulders implied measured move suggesting that the exchange rate could climb an additional 14% from current levels to challenge psychological resistance at 94.00.

The IG Client Sentiment Report shows 36.15% of traders are net-long with the ratio of traders short to long at 1.77 to 1. The number of traders net-long is 4.23% higher than yesterday and 5.29% lower from last week, while the number of traders net-short is 1.42% lower than yesterday and 10.77% lower from last week.
We typically take a contrarian view to crowd sentiment, and the fact traders are…
Read More: AUD/JPY, EUR/JPY, GBP/JPY Key Levels


