
AUDUSD and Technical Patterns Talking Points:
- AUDUSD is developing a head-and-shoulders pattern within a larger head-and-shoulders pattern
- Head-and-shoulders patterns are reversal patterns, so a key element is a strong prevailing trend to turn
- The build up over the past month doesn’t have a strong rally while the larger pattern over the past 15 months has a strong bull trend
I will admit: head-and-shoulders patterns are one of my favorite technical patterns to find in the markets. Once you know the structure of the chart configuration, it can seem they occur with remarkable frequency in ‘nature’. Given the foundation of a head-and-shoulders (H&S) is congestion with a flat support (or resistance for an inverse example) and deteriorating high for resistance, this in fact does happen very often. That said, the simple existence of these formations does not dictate the likelihood of a big reversal as technical textbooks would insinuate.
One of the key aspects of a H&S that I look for in order to establish potential and relevance is the significance of a prevailing trend into the congestion. Typically, this technical pattern is one associated to reversals. A high, higher high and lower high suggests failing strength in bullish conviction. That can speak to a simple period of consolidation or the potential of a full reversal. Dictating a turn or continuation should come with the break of either a ‘neckline’ (in a turn) or previous high (in continuation). Yet, in a reversal, projections depend in part on the retracement of the preceding move. In short, if there is no trend to reverse; the potential of the move is likely to be reserved.
Chart of AUDUSD with 50-Day Moving Average (Daily)
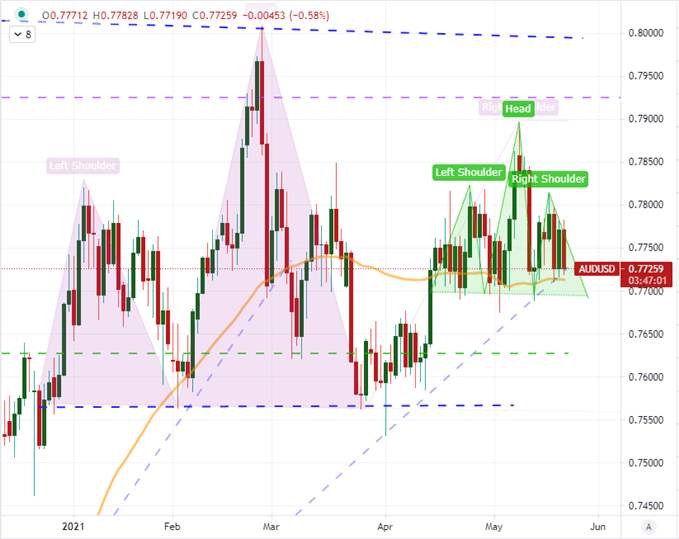
Chart Created on Tradingview Platform
To give an example of a H&S that is more likely to struggle with its turn versus one that is better staged, AUDUSD happens to offer up both but on different time frames. First, on the daily chart, we find the structure of a head-and-shoulders developed over the past month. The ‘left shoulder’ formed in the late April highs, ‘head’ was the 0.79 high at the beginning of May and subsequent ‘right shoulder’ was the lower highs around 0.7800 this past week. The ‘neckline’ which is support is roughly 0.7700. The pattern is there, however, how much stored energy is there should we establish a reversal? To confirm a break below 0.7700, we will first have some ‘slippage’ to our entry point – as you don’t want to get in before confirming it is an actual break. Then to project how far it could run before hitting the next meaningful support, we have an heavier floor down near 0.7575. That isn’t a very large window, and I do not attempt to go for full ranges as it lowers the probability of success. There just isn’t a lot of run for this…
Read More: The Critical Ingredient for Head and Shoulders Pattern


