

Stock market leverage, the big accelerator on the way up, and on the way down.
By Wolf Richter for WOLF STREET.
Increasing leverage – borrowing money to buy stocks – puts buying pressure on the stock market up. Declining leverage – selling stocks to reduce leverage – puts selling pressure on the market. Stock market leverage has ballooned over the past 20 months by historic proportions, which has contributed to the historic surge in stock prices. So we’ll keep an eye on leverage.
The tip of the iceberg of stock-market leverage that we can actually see is margin debt, which is reported on a monthly basis by FINRA, based on data reported by its member brokers.
Other forms of stock-market leverage occur in the shadows, such as Securities Based Lending (SBA) that isn’t tracked and reported in a centralized manner, though some banks choose to disclose it quarterly or annually.
There is leverage associated with options and other equities-based derivatives. Then there is leverage at the institutional level such as with hedge funds, which doesn’t show up until a fund implodes, such as Archegos, and everyone gets to pick through the debris.

The only form of leverage we can see monthly, margin debt, gives us an indication of the direction of the much larger overall stock market leverage.
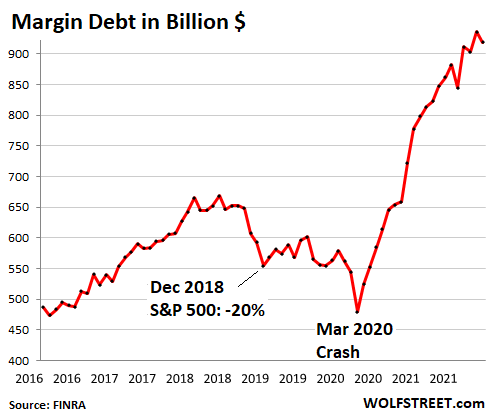
So, recall that in November, a major fiasco happened: Despite all kinds of bullishness out there, stocks as measured by the S&P 500 index didn’t rise. I mean, what affront! They actually ticked down a smidge for the month, -0.8%. But beneath the surface of the indices, all kinds of mayhem broke out, with lots of the most hyped stocks plunging.
And margin debt, after its historic spike? Stock market margin debt in November fell by $17 billion, from the tip of the spike, to a still monstrous $918.6 billion, still up year-over-year by $197 billion, or by 27%, and up from January 2020 by $357 billion, or by 64%, for one doozie of a spike:
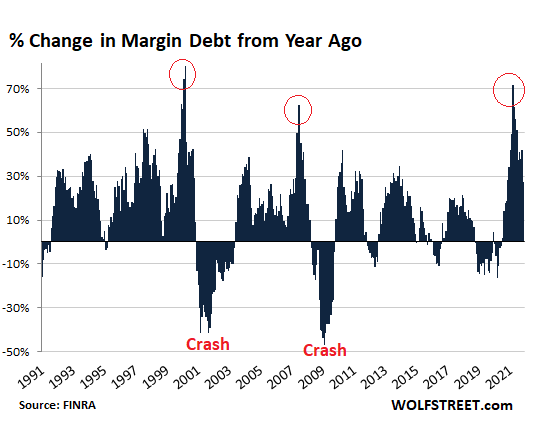
The boom in margin debt was a powerful fuel poured on the stock market over the past 20 months – and it was a huge outlier by historical standards, as the chart below of year-over-year changes in margin debt shows. In terms of dollars, nothing in the data going back to 1991 comes close to the year-over-year increases in margin debt over the past 20 months.
In percentage terms, there were only two months when the year-over-year percentage increases were even higher: February and March 2000, on the eve of the dotcom crash:
This explosion of margin debt and broader stock market leverage cannot predict when the market will crater. It shows that as long as margin debt continues to balloon, newly borrowed fuel is thrown on stocks.
What this explosion in margin debt does predict is that when the market falls enough to scare investors, or worse, falls enough to force investors, into selling stocks to reduce their…
Read More: Stocks Don’t Need More Alarm Bells, They’re Already Clanging and Jangling


