
To help explain what happened to the gold price in 2021, it is helpful to reflect upon what the gold price did in late 2020. Gold prices reached a historical high of US$2,073 in early August 2020, driven by safe-haven fears associated with the beginning of the pandemic, the decline in the USD, a ramp up in central bank quantitative easing measures, and the associated decline in US interest rates.
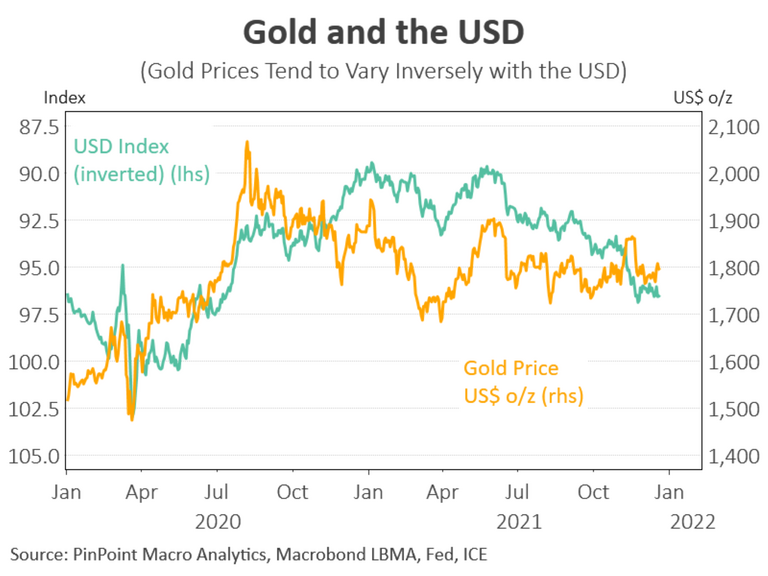
Gold prices then declined for seven months, until they reached US$1,677 in early March 2021, a 19.1% decline. Fears of an extended lockdown, a collapse in the global economy, and under-performing stockmarkets began to subside as the economy and global stockmarkets began to outperform. The heat subsequently began to come out of the gold price. A decline in the world consumption of gold, led by a reduction in global jewellery demand and central bank gold holdings helped further contribute to the seven month decline in gold prices (see chart).

From a technical perspective, the decline in the price of gold from the August 2020 historical high and most of the 2021 trading range can be seen as a long-term consolidation pattern to the long run up to the historical gold price reached in August 2020 of US$2,073 (see chart).

Over the course of 2021, gold jewellery consumption began to recover, and central banks began increasing their gold holdings (see chart above). Although the amount of quarterly gold consumed by both of these traditional gold buyers has yet to return to the quarterly amount of gold consumed in the years prior to the peak in the August 2020 gold price. In addition to gold consumption, two other major factors had a dominate influence over the gold price during 2021.
First, the lift in US inflation generated a large fall in real (inflation-adjusted) US ten-year bond yields. Historically, a fall in US real yields has been supportive for the gold price.

Secondly, after reaching a near three-year low in early January 2021, the US dollar (USD) began to appreciate steadily over the course of 2021. A recovering and subsequent booming US economy helped drive the lift in the USD. Also driving a significant amount of strength in the USD over 2021 was the realisation that the US economy needed no further stimulus, and the next move in interest rates by the Fed was likely to be a lift in interest rates.
As part of the process of tightening monetary policy, the Fed began to taper their asset purchases in November 2021 by US$15 billion per month, and then doubled that rate of tapering to US$30 billion per month in mid December. Historically, the gold price has had an inverse relationship to the USD. So as the USD began to rise strongly in mid 2021, gold prices began to fall and, on 9 August, gold prices fell far enough to test the 2021 low in the gold price. Some consolidation in the USD’s recent strength…
Read More: Gold and the next step for 2022


